Liquidity Zone IndicatorLiquidity Zone Indicator
This PineScript indicator for TradingView identifies liquidity zones in the market where significant trading activity occurs, based on volume spikes and price levels. It highlights areas where large orders may be filled, useful for day traders and scalpers.
Features:
Detects bullish and bearish liquidity zones using a lookback period (default: 50 bars) and volume threshold (default: 1.5x average volume).
Displays zones as shaded boxes or diamond markers above/below bars, customizable by color.
Option to extend zones until price breaks through, with dynamic transparency for better visualization.
Includes an alert for when a liquidity zone is hit.
Settings:
Liquidity Lookback: Number of bars to analyze for high/low price levels.
Volume Threshold: Multiplier for detecting volume spikes.
Display as Zone: Toggle between zone boxes or markers.
Extend Zone: Keep zones active until price crosses them.
Zone Color: Customize the color of zones or markers.
Ideal for traders looking to spot potential reversal or breakout areas driven by liquidity.
אינדיקטורים ואסטרטגיות

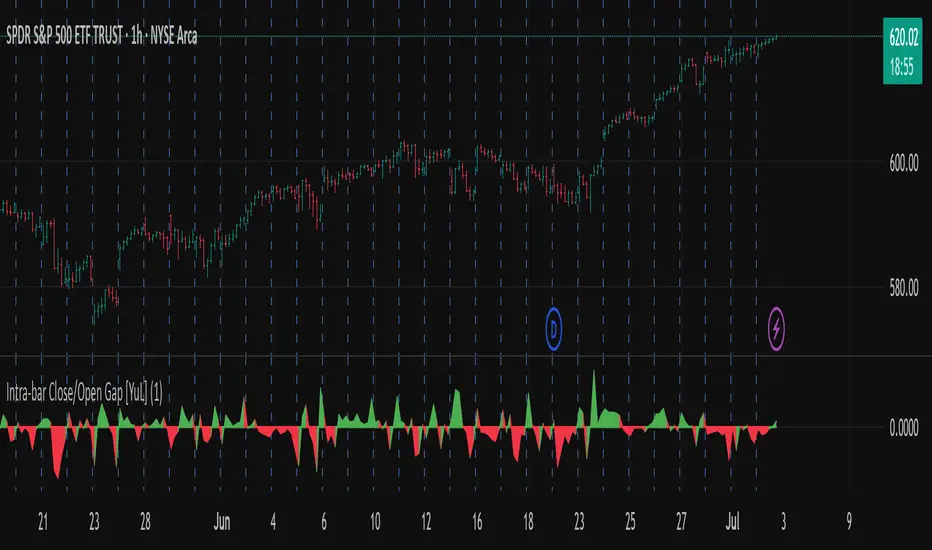
Intra-bar Close/Open Gap [YuL]Just checking one idea: look at gaps between close and open bars on lower timeframe to try to estimate how much slippage exists there that may be a result of buying or selling pressure.
Perhaps it only useful in real time to see if situation of the current bar is changing.
Open to ideas and suggestions.
Live Price Watermark (Flashing Overlay)Displays the current price as a large, centered watermark directly on your chart. The text color updates dynamically:
- Green when price rises
- Red when price falls
- Translucent black when unchanged

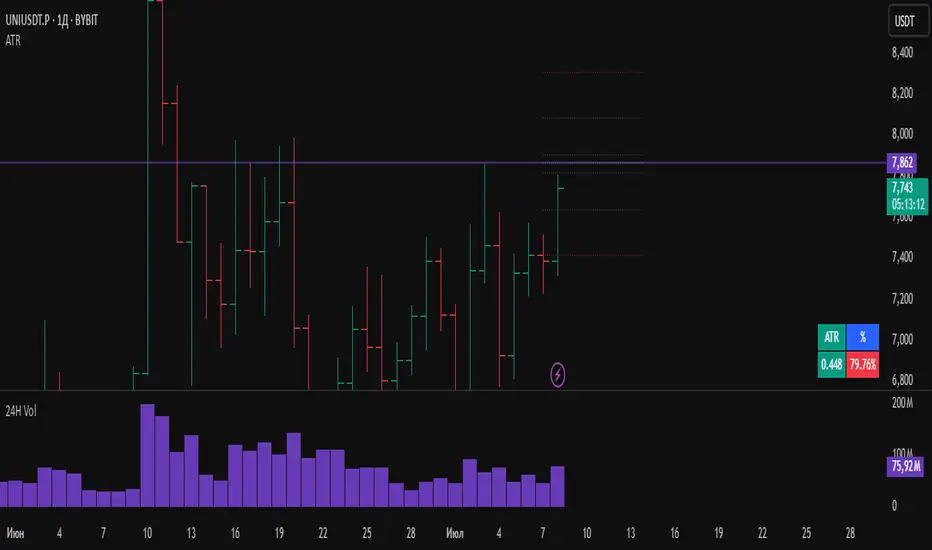
ATRWhat the Indicator Shows:
A compact table with four cells is displayed in the bottom-left corner of the chart:
| ATR | % | Level | Lvl+ATR |
Explanation of the Columns:
ATR — The averaged daily range (volatility) calculated with filtering of abnormal bars (extremely large or small daily candles are ignored).
% — The percentage of the daily ATR that the price has already covered today (the difference between the daily Open and Close relative to ATR).
Level — A custom user-defined level set through the indicator settings.
Lvl+ATR — The sum of the daily ATR and the user-defined level. This can be used, for example, as a target or stop-loss reference.
Color Highlighting of the "%" Cell:
The background color of the "%" ATR cell changes depending on the value:
✅ If the value is less than 10% — the cell is green (market is calm, small movement).
➖ If the value is between 10% and 50% — no highlighting (average movement, no signal).
🟡 If the value is between 50% and 70% — the cell is yellow (movement is increasing, be alert).
🔴 If the value is above 70% — the cell is red (the market is actively moving, high volatility).
Key Features:
✔ All ATR calculations and percentage progress are performed strictly based on daily data, regardless of the chart's current timeframe.
✔ The indicator is ideal for intraday traders who want to monitor daily volatility levels.
✔ The table always displays up-to-date information for quick decision-making.
✔ Filtering of abnormal bars makes ATR more stable and objective.
What is Adaptive ATR in this Indicator:
Instead of the classic ATR, which simply averages the true range, this indicator uses a custom algorithm:
✅ It analyzes daily bars over the past 100 days.
✅ Calculates the range High - Low for each bar.
✅ If the bar's range deviates too much from the average (more than 1.8 times higher or lower), the bar is considered abnormal and ignored.
✅ Only "normal" bars are included in the calculation.
✅ The average range of these normal bars is the adaptive ATR.
Detailed Algorithm of the getAdaptiveATR() Function:
The function takes the number of bars to include in the calculation (for example, 5):
The average of the last 5 normal bars is calculated.
pinescript
Копировать
Редактировать
adaptiveATR = getAdaptiveATR(5)
Step-by-Step Process:
An empty array ranges is created to store the ranges.
Daily bars with indices from 1 to 100 are iterated over.
For each bar:
🔹 The daily High and Low with the required offset are loaded via request.security().
🔹 The range High - Low is calculated.
🔹 The temporary average range of the current array is calculated.
🔹 The bar is checked for abnormality (too large or too small).
🔹 If the bar is normal or it's the first bar — its range is added to the array.
Once the array accumulates the required number of bars (count), their average is calculated — this is the adaptive ATR.
If it's not possible to accumulate the required number of bars — na is returned.
Что показывает индикатор:
На графике внизу слева отображается компактная таблица из четырех ячеек:
ATR % Уровень Ур+ATR
Пояснения к столбцам:
ATR — усреднённый дневной диапазон (волатильность), рассчитанный с фильтрацией аномальных баров (слишком большие или маленькие дневные свечи игнорируются).
% — процент дневного ATR, который уже "прошла" цена на текущий день (разница между открытием и закрытием относительно ATR).
Уровень — пользовательский уровень, который задаётся вручную через настройки индикатора.
Ур+ATR — сумма уровня и дневного ATR. Может использоваться, например, как ориентир для целей или стопов.
Цветовая подсветка ячейки "%":
Цвет фона ячейки с процентом ATR меняется в зависимости от значения:
✅ Если значение меньше 10% — ячейка зелёная (рынок пока спокоен, маленькое движение).
➖ Если значение от 10% до 50% — фон не подсвечивается (среднее движение, нет сигнала).
🟡 Если значение от 50% до 70% — ячейка жёлтая (движение усиливается, повышенное внимание).
🔴 Если значение выше 70% — ячейка красная (рынок активно движется, высокая волатильность).
Особенности работы:
✔ Все расчёты ATR и процентного прохождения производятся исключительно по дневным данным, независимо от текущего таймфрейма графика.
✔ Индикатор подходит для трейдеров, которые торгуют внутри дня, но хотят ориентироваться на дневные уровни волатильности.
✔ В таблице всегда отображается актуальная информация для принятия быстрых торговых решений.
✔ Фильтрация аномальных баров делает ATR более устойчивым и объективным.
Что такое адаптивный ATR в этом индикаторе
Вместо классического ATR, который просто усредняет истинный диапазон, здесь используется собственный алгоритм:
✅ Он берет дневные бары за последние 100 дней.
✅ Для каждого из них рассчитывает диапазон High - Low.
✅ Если диапазон бара слишком сильно отличается от среднего (более чем в 1.8 раза больше или меньше), бар считается аномальным и игнорируется.
✅ Только нормальные бары попадают в расчёт.
✅ В итоге считается среднее из диапазонов этих нормальных баров — это и есть адаптивный ATR.
Подробный алгоритм функции getAdaptiveATR()
Функция принимает количество баров для расчёта (например, 5):
Считается 5 последних нормальных баров
pinescript
Копировать
Редактировать
adaptiveATR = getAdaptiveATR(5)
Пошагово:
Создаётся пустой массив ranges для хранения диапазонов.
Перебираются дневные бары с индексами от 1 до 100.
Для каждого бара:
🔹 Через request.security() подгружаются дневные High и Low с нужным смещением.
🔹 Считается диапазон High - Low.
🔹 Считается временное среднее диапазона по текущему массиву.
🔹 Проверяется, не является ли бар аномальным (слишком большой или маленький).
🔹 Если бар нормальный или это самый первый бар — его диапазон добавляется в массив.
Как только массив набирает заданное количество баров (count), берётся их среднее значение — это и есть адаптивный ATR.
Если не удалось набрать нужное количество баров — возвращается na.
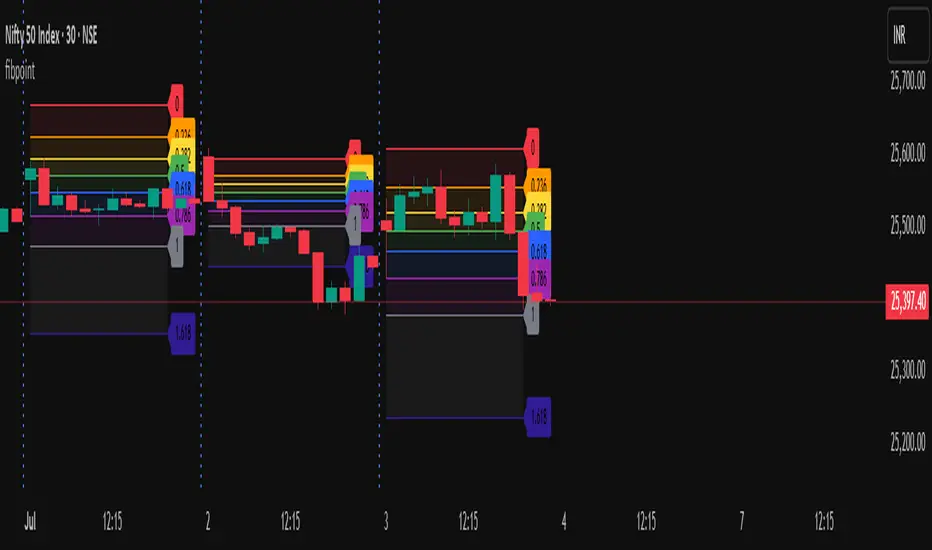
fibpointLibrary "fibpoint"
A library for generating Fibonacci retracement levels on a chart, including customizable lines, labels, and filled areas between levels. It provides functionality to plot Fibonacci levels based on given price points and bar indices, with options for custom levels and colors.
getFib(startPoint, endPoint, startIdx, endIdx, fibLevels, fibColors, tsp)
Calculates Fibonacci retracement levels between two price points and draws corresponding lines and labels on the chart.
Parameters:
startPoint (float) : The starting price point for the Fibonacci retracement.
endPoint (float) : The ending price point for the Fibonacci retracement.
startIdx (int) : The bar index where the Fibonacci retracement starts.
endIdx (int) : The bar index where the Fibonacci retracement ends.
fibLevels (array) : An optional array of custom Fibonacci levels (default is ).
fibColors (array) : An optional array of colors for each Fibonacci level (default is a predefined color array).
tsp (int) : The transparency level for the fill between Fibonacci levels (default is 90).
Returns: A tuple containing an array of fibItem objects (each with a line and label) and an array of linefill objects for the filled areas between levels.
fibItem
A custom type representing a Fibonacci level with its associated line and label.
Fields:
line (series line) : The line object drawn for the Fibonacci level.
label (series label) : The label object displaying the Fibonacci level value.
Volume bar range# Volume Bar Range (VBR) Indicator
## Overview
The Volume Bar Range indicator identifies key support and resistance levels based on high-volume price bars. It creates a visual range that represents significant price levels where the market has shown strong interest through volume confirmation.
## Features
### Visual Range Display
- **Blue/Aqua Area**: Shows the price range of the highest volume bar within the lookback period
- **Dynamic Color**: The fill color changes to indicate whether the range is stable (aqua) or newly updated (white)
- **Boundary Lines**: Invisible white lines mark the upper and lower boundaries of the range
### Trading Signals
- **BUY Signal**: Blue upward arrow appears when price breaks above the resistance level with volume confirmation
- **SELL Signal**: Black downward arrow appears when price breaks below the support level with volume confirmation
## How to Use
### Setup
1. Apply the indicator to any chart
2. The indicator automatically identifies the highest volume bar in the last 55 periods
3. The price range of this high-volume bar becomes your support/resistance zone
### Trading Strategy
- **Range Trading**: Trade within the identified support/resistance range
- **Breakout Trading**: Enter positions when price breaks above resistance (BUY) or below support (SELL)
- **Volume Confirmation**: Only take signals when current volume exceeds the 21-period average
### Signal Interpretation
- **BUY Signal**: Price closes above the resistance level with above-average volume
- **SELL Signal**: Price closes below the support level with above-average volume
- **No Signal**: Price remains within the range or volume is insufficient
## Key Parameters
- **Lookback Period**: 55 bars (automatically identifies the highest volume bar)
- **Volume MA**: 21-period simple moving average for volume confirmation
- **Signal Size**: Tiny markers to avoid chart clutter
## Best Practices
- Use on multiple timeframes for confirmation
- Combine with other technical indicators for stronger signals
- Pay attention to the color changes in the range area
- Consider market context and overall trend direction
## Ideal Markets
- Works well on liquid markets with consistent volume patterns
- Effective on stocks, forex, and crypto markets
- Best suited for swing trading and medium-term analysis
This indicator is particularly useful for traders who rely on volume analysis and want to identify key price levels where the market has shown significant interest.

All SMAs Bullish/Bearish Screener (Enhanced)All SMAs Bullish/Bearish Screener Enhanced: Uncover High-Conviction Trend Alignments with Confidence
Description:
Are you ready to elevate your trading from mere guesswork to precise, data-driven decisions? The "All SMAs Bullish/Bearish Screener Enhanced" is not just another indicator; it's a sophisticated, yet user-friendly, trend-following powerhouse designed to cut through market noise and pinpoint high-probability trading opportunities. Built on the foundational strength of comprehensive Moving Average confluence and fortified with critical confirmation signals from Momentum, Volume, and Relative Strength, this script empowers you to identify truly robust trends and manage your trades with unparalleled clarity.
The Power of Multi-Factor Confluence: Beyond Simple Averages
In the unpredictable world of financial markets, true strength or weakness is rarely an isolated event. It's the harmonious alignment of multiple technical factors that signals a high-conviction move. While our original "All SMAs Bullish/Bearish Screener" intelligently identified stocks where price was consistently above or below a full spectrum of Simple Moving Averages (5, 10, 20, 50, 100, 200), this Enhanced version takes it a crucial step further.
We've integrated a powerful three-pronged confirmation system to filter out weaker signals and highlight only the most compelling setups:
Momentum (Rate of Change - ROC): A strong trend isn't just about price direction; it's about the speed and intensity of that movement. Positive momentum confirms that buyers are still aggressively pushing price higher (for bullish signals), while negative momentum validates selling pressure (for bearish signals).
Volume: No trend is truly trustworthy without the backing of smart money. Above-average volume accompanying an "All SMAs" alignment signifies strong institutional participation and conviction behind the move. It separates genuine trend starts from speculative whims.
Relative Strength Index (RSI): This versatile oscillator ensures the trend isn't just "there," but that it's developing healthily. We use RSI to confirm a bullish bias (above 50) or a bearish bias (below 50), adding another layer of confidence to the direction.
When the price aligns above ALL six critical SMAs, and is simultaneously confirmed by robust positive momentum, healthy volume, and a bullish RSI bias, you have an exceptionally strong "STRONGLY BULLISH" signal. This confluence often precedes sustained upward moves, signaling prime accumulation phases. Conversely, a "STRONGLY BEARISH" signal, where price is below ALL SMAs with negative momentum, confirming volume, and a bearish RSI bias, indicates powerful distribution and potential for significant downside.
How to Use This Enhanced Screener:
Add to Chart: Go to TradingView's Pine Editor, paste the script, and click "Add to Chart."
Customize Parameters: Fine-tune the lengths of your SMAs, RSI, Momentum, and Volume averages via the indicator's settings. Experiment to find what best suits your trading style and the assets you trade.
Choose Your Timeframe Wisely:
Daily (1D) and 4-Hour (240 min) are highly recommended. These timeframes cut through intraday noise and provide more reliable, actionable signals for swing and position trading.
Shorter timeframes (e.g., 15min, 60min) can be used by advanced day traders for very short-term entries, but be aware of increased volatility and noise.
Visual Confirmation:
Green/Red Triangles: Appear on your chart, indicating confirmed bullish or bearish signals.
Background Color: The chart background will subtly turn lime green for "STRONGLY BULLISH" and red for "STRONGLY BEARISH" conditions.
On-Chart Status Table: A clear table displays the current signal status ("STRONGLY BULLISH/BEARISH," or "SMAs Mixed") for immediate feedback.
Set Up Alerts (Your Primary Screener Tool): This is the game-changer! Create custom alerts on TradingView based on the "Confirmed Bullish Trade" and "Confirmed Bearish Trade" conditions. Receive instant notifications (email, pop-up, mobile) for any stock in your watchlist that meets these stringent criteria. This allows you to scan the entire market effortlessly and act decisively.
Strategic Stop-Loss Placement: The Trader's Lifeline
Even the most robust signals can fail. Protecting your capital is paramount. For this trend-following strategy, your stop-loss should be placed where the underlying trend structure is broken.
For a "STRONGLY BULLISH" Trade: Place your stop-loss just below the most recent significant swing low (higher low). This is the last point where buyers stepped in to support the price. If price breaks below this, your bullish thesis is invalidated.
For a "STRONGLY BEARISH" Trade: Place your stop-loss just above the most recent significant swing high (lower high). If price breaks above this, your bearish thesis is invalidated.
Alternatively, consider placing your stop-loss just below the 20-period SMA (for bullish trades) or above the 20-period SMA (for bearish trades). A significant close beyond this intermediate-term average often indicates a critical shift in momentum. Always ensure your chosen stop-loss adheres to your pre-defined risk per trade (e.g., 1-2% of capital).
Disciplined Profit Booking: Maximizing Gains
Just as important as knowing when you're wrong is knowing when to take profits.
Trailing Stop-Loss: As your trade moves into profit, trail your stop-loss upwards (for longs) or downwards (for shorts). You can trail it using:
Previous Swing Lows/Highs: Move your stop to just below each new higher low (for longs) or just above each new lower high (for shorts).
A Moving Average (e.g., 10-period or 20-period SMA): If price closes below your chosen trailing SMA, exit. This allows you to ride the trend while protecting accumulated profits.
Target Levels: Identify potential resistance levels (for longs) or support levels (for shorts) using pivot points, previous highs/lows, or Fibonacci extensions. Consider taking partial profits at these levels and letting the rest run with a trailing stop.
Loss of Confluence: If the "STRONGLY BULLISH/BEARISH" condition ceases to be met (e.g., RSI crosses below 50, or volume drops significantly), this can be a signal to reduce or exit your position, even if your stop-loss hasn't been hit.
The "All SMAs Bullish/Bearish Screener Enhanced" is your comprehensive partner in navigating the markets. By combining robust trend identification with critical confirmation signals and disciplined risk management, you're equipped to make smarter, more confident trading decisions. Add it to your favorites and unlock a new level of precision in your trading journey!
#PineScript #TradingView #SMA #MovingAverage #TrendFollowing #StockScreener #TechnicalAnalysis #Bullish #Bearish #QQQ #Momentum #Volume #RSI #SPY #TradingStrategy #Enhanced #Signals #Analysis #DayTrading #SwingTrading

RSI-BBGun-v6.1RSI BB Gun – Operator's Guide
“Eyes on target. Wait for the right moment. Then strike.”
________________________________________
🎯 Mission Objective
RSI BB Gun identifies extreme market conditions using RSI and Bollinger Bands, then overlays trend and volatility intelligence so you know when the setup is real.
The ❌ is your target acquisition signal—price just moved from an extreme zone back into play. Now you’ve got a clean radar lock.
________________________________________
📡 How to Operate
🟣 Step 1: Watch for the ❌'s (Black X = RSI & Bollinger Band Extremes Encountered)
• The Purple X means price and RSI are both stretched—and just snapped back into range.
• The target is now in the cross hairs and potentially ready for engagement.
🟥 Step 2: Confirm the Trend
• The thick ribbon tells you if the trend is with you:
o 🟢 Green = Uptrend. Focus on long setups.
o 🔴 Red = Downtrend. Focus on puts or short plays.
• Align with trend. Only engage when the field favors your position.
🔺 Step 3: Evaluate Signal Context
• Green Triangles = price just crossed below lower Bollinger Band (oversold).
• Red Triangles = price crossed above upper Band (overbought).
• Horizontal Lines Disappeared = The bar after the green or red horizontal line disappears means its time. We patiently wait for this as it means the momentum may be changing.
• These are your early indicators—they scout the setup on the GO / NO GO DECISION.
• ❌ + triangle + trend = clean shot.
________________________________________
☁️ Avoid These Situations
• ❌ in a choppy/no-trend zone = false alarm. Don’t engage.
• Repeated black ❌s without a purple ❌confirmation = low conviction. Let it go.
________________________________________
________________________________________
🪖 Operator's Mindset
“You don’t chase trades. You stalk them. When the ❌ flashes, the system has found a target. What you do next is up to your discipline, your tools, and your plan.”
________________________________________
Note: This is a free version. Upcoming paid version includes multi-timeframes working together. Multiple strategies. Volatility meter. Make money and master the BB Gun so that you can elevate to the Snipers weapon.
🔒 Want More Firepower?
Upgraded version coming soon. Unlocks next-gen targeting tools:
• Multi-timeframe RSI intelligence in a live dashboard
• Precision-timed combo signals based on layered volatility + RSI logic
• Advanced trend filters, trade zone overlays, and sniper-level entry indicators
• Ideal for swing traders and options strategists who want clarity under pressure
💥 Budget-friendly. No subscription. Upgrade when you're ready to go Pro.
Tip: Make 4+ trades mastering this setup. Then use a small portion of the trades to gain more features. Always be in a position you cannot lose.
🆚 Why This Beats Standard RSI/BB Tools
Mission Feature Basic Indicators RSI Ribbon Lite
Trend Confirmation ❌ ✅ Ribbon Overlay
Multi-Timeframe Awareness ❌ ✅ 5-Timeframe RSI Grid
Volatility Confirmation ❌ ✅ Weighted ATR Scoring
Combo Signal Alerts ❌ ✅ ❌ Reentry Combo Alerts
TradingView Alerts ❌ ✅ Built-In Radar Ping
#rsi #bb #bollingerbands #hull ma #trend

Omega Market Mood Meter [OmegaTools]The Omega Market Mood Meter is a precision-built sentiment oscillator that captures the market’s emotional intensity through a multi-layered RSI system. Designed for traders who seek to align with the market's true behavioral state, it blends momentum readings with a brand-new, rarely-seen innovation: the Sentiment-Weighted Moving Average (WMA-Ω)—a trend filter that dynamically adjusts to the market’s psychological tone.
🧠 Market Mood Oscillator
At its core, the Ω 3M oscillator aggregates three RSI-based components:
RSI(9) on close — captures short-term tension;
RSI(21) on HLC3 — balances medium-term positioning;
RSI(50) on HL2 — reflects long-term directional weight.
Each input is scaled and weighted to contribute to a final oscillator centered around zero, with ±50 and ±100 acting as key sentiment boundaries. When values exceed ±100, the market is likely reaching emotional extremes—zones that often precede reversals or require caution.
Visual features include:
Dynamic Background Highlighting: automatically emphasizes extreme sentiment zones.
Reference Lines: plotted at ±100, ±50, and 0 for fast sentiment interpretation.
🔥 WMA-Ω: Sentiment-Weighted Moving Average
The standout innovation of this tool is the Weighted Market Mood Moving Average, or WMA-Ω—a proprietary calculation that averages price using the absolute value of sentiment as its weighting force. This approach gives greater importance to price during periods of strong emotional conviction (either bullish or bearish), resulting in a context-aware trend filter that reacts only when sentiment truly matters.
This technique:
Filters noise during low-volatility or indecisive conditions;
Enhances reliability by reacting to meaningful sentiment surges;
Offers a more psychologically-adjusted trend baseline compared to traditional MAs.
Visually:
When price is above WMA-Ω, a semi-transparent bullish fill highlights underlying strength;
When below, a bearish fill reveals dominant downward sentiment.
This feature is unique among public TradingView tools and provides an edge in identifying trend quality with psychological context.
✅ How to Use
Extreme Sentiment Zones (±100): Use as contrarian warning zones or signal dampeners.
Crosses of WMA-Ω: Treat these as psychological trend confirmations; price above indicates structurally bullish sentiment and vice versa.
Range-bound Bias: Between ±50, sentiment may be indecisive; watch for breakout or alignment with WMA-Ω.
Advanced Confluence: Combine with other Omega tools (e.g., Ω Bias Forecaster, Ω IV Walls) for powerful regime-based strategies.
Omega Market Mood Meter is ideal for discretionary and systematic traders who want a clean, multi-timeframe sentiment readout and a cutting-edge weighted trend engine grounded in market psychology.

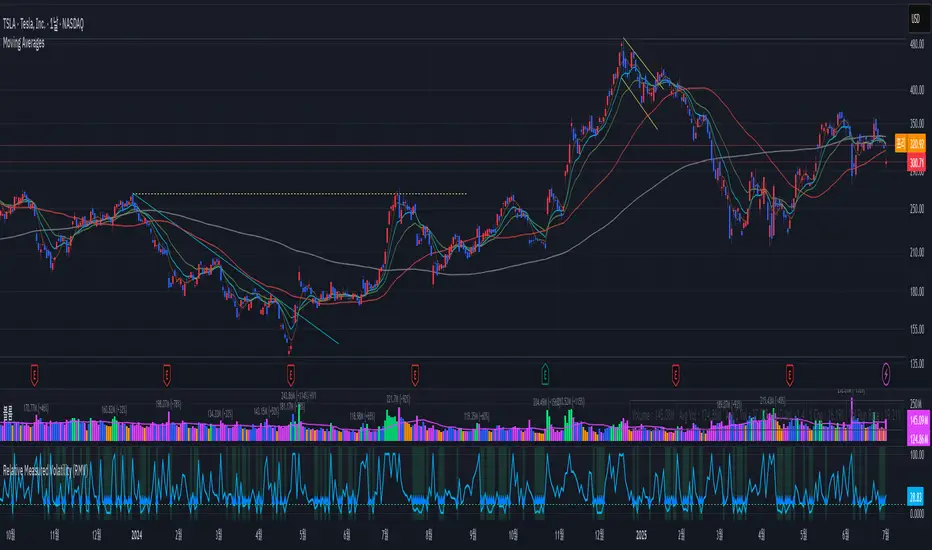
Relative Measured Volatility (RMV)RMV • Volume-Sensitive Consolidation Indicator
A lightweight Pine Script that highlights true low-volatility, low-volume bars in a single squeeze measure.
What it does
Calculates each bar’s raw High-Low range.
Down-weights bars where volume is below its 30-day average, emphasizing genuine quiet periods.
Normalizes the result over the prior 15 bars (excluding the current bar), scaling from 0 (tightest) to 100 (most volatile).
Draws the series as a step plot, shades true “tight” bars below the user threshold, and marks sustained squeezes with a small arrow.
Key inputs
Lookback (bars): Number of bars to use for normalization (default 15).
Tight Threshold: RMV value under which a bar is considered squeezed (default 15).
Volume SMA Period: Period for the volume moving average benchmark (default 30).
How it works
Raw range: barRange = high - low
Volume ratio: volRatio = min(volume / sma(volume,30), 1)
Weighted range: vwRange = barRange * volRatio
Rolling min/max (prior 15 bars): exclude today so a new low immediately registers a 0.
Normalize: rmv = clamp(100 * (vwRange - min) / (max - min), 0, 100)
Visualization & signals
Step line for exact bar-by-bar values.
Shaded background when RMV < threshold.
Consecutive-bar filter ensures arrows only appear when tightness lasts at least two bars, cutting noise.
Why use it
Quickly spot consolidation zones that combine narrow price action with genuine dry volume—ideal for swing entries ahead of breakouts.
[eLm] 0-1-2# 📈 Market Structure Indicator – Counter System
This indicator dynamically analyzes price action to detect key market structure shifts and trend strength using four essential formations:
## 🔍 Detected Structures
- **Higher High (HH):** A candle forming a new high above recent peaks
- **Lower Low (LL):** A candle forming a new low below recent bottoms
- **Higher Low (HL):** A higher dip, indicating potential trend continuation
- **Lower High (LH):** A lower peak, signaling potential weakness
## 🧠 Structure Protection Logic
After a HH or LL is formed, if price does not breach that level within a user-defined number of candles, the level is considered **"protected."**
This provides insight into trend strength and market reaction.
## 🔢 HL / LH Counter System
- Each HL or LH increases a counter.
- A new HH or LL **resets** the corresponding counter to zero.
> This helps visualize how many consecutive HL or LH structures have occurred — useful for measuring trend momentum.
## 🎯 Use Cases
- Trend following and confirmation
- Early trend reversal detection
- Building structure-based trading strategies
- Understanding price behavior and market intent
---
> **Note:** This indicator does not provide financial advice. It is designed to support technical analysis with clear, structure-based visual signals.
15-Min ORB Indicator with Breakout Targets **What this indicator does:**
The 15-Min ORB (Opening Range Breakout) Indicator helps traders spot breakout trades by automatically detecting the high and low of the first 15 minutes after a session opens. It then monitors for breakouts above or below this range and plots dynamic take-profit levels based on your chosen multipliers.
**How it works:**
You set the start time for your session (hour and minute) in the settings.
The indicator marks the high and low during the first 15 minutes after your chosen open time, drawing lines on the chart and, if enabled, labels for these levels.
If price breaks above the 15-min high, a potential long breakout is identified; if it breaks below the low, a potential short breakout is detected.
Upon a breakout, the script calculates the distance from the entry (breakout) to the opposite side of the 15-min range and uses your input multipliers to project two take-profit levels (TP1/TP2).
All lines and labels (for the range and targets) can be individually toggled on or off in the settings.
Both the 15-min range and the targets can be styled (color, line style, label position).
**How to use it:**
Add the indicator to your chart.
Set the session start hour and minute to match your instrument’s open (e.g., 9:30 for US stocks or futures).
Use the settings to customize which levels and labels are shown, their appearance, and the target expansion multiples.
When price breaks out above or below the opening range, the script will plot TP1 and TP2 lines at your chosen risk/reward multiples, and label them if desired.
You can use the visual levels for trade entries, profit taking, or alerts.
**What makes it unique and useful:** >
Unlike many basic ORB indicators, this script not only marks the opening range but also tracks breakouts, auto-plots your profit targets based on range expansion, and gives you full control over display (styles, toggles, and label positions).
The TP targets are dynamic and can be set to any multiples, adapting to your risk/reward plan and breakout style.
Everything is customizable for your own session times, instrument, or trading approach.
**Typical uses:**
Intraday traders looking for clear breakout setups around the session open.
Automated R-multiple target planning for both long and short trades.
Visualizing volatility and measuring early price expansion.

Warrior Trading Momentum Strategy
# 🚀 Warrior Trading Momentum Strategy - Day Trading Excellence
## Strategy Overview
This comprehensive Pine Script strategy replicates the proven methodologies taught by Ross Cameron and the Warrior Trading community. Designed for active day traders, it identifies high-probability momentum setups with strict risk management protocols.
## 📈 Core Trading Setups
### 1. Gap and Go Trading
- **Primary Focus**: Stocks gapping up 2%+ with volume confirmation
- **Entry Logic**: Breakout above gap open with momentum validation
- **Volume Filter**: 2x average volume requirement for quality setups
### 2. ABCD Pattern Recognition
- **Pattern Detection**: Automated identification of classic ABCD reversal patterns
- **Validation**: A-B and C-D move relationship analysis
- **Entry Trigger**: D-point breakout with volume confirmation
### 3. VWAP Momentum Plays
- **Strategy**: Entries near VWAP with bounce confirmation
- **Distance Filter**: Configurable percentage distance for optimal entries
- **Direction Bias**: Above VWAP bullish momentum validation
### 4. Red to Green Reversals
- **Setup**: Reversal patterns after consecutive red candles
- **Confirmation**: Volume spike with bullish close required
- **Momentum**: Trend change validation with RSI support
### 5. Breakout Momentum
- **Logic**: Breakouts above recent highs with volume
- **Filters**: EMA20 and RSI confirmation for quality
- **Trend**: Established momentum direction validation
## ⚡ Key Features
### Smart Risk Management
- **Position Sizing**: Automatic calculation based on account risk percentage
- **Stop Loss**: 2 ATR-based stops for volatility adjustment
- **Take Profit**: Configurable risk-reward ratios (default 1:2)
- **Trailing Stops**: Profit protection with adjustable triggers
### Advanced Filtering System
- **Time Filters**: Market hours trading with lunch hour avoidance
- **Volume Confirmation**: Multi-timeframe volume analysis
- **Momentum Indicators**: RSI and moving average trend validation
- **Quality Control**: Multiple confirmation layers for signal accuracy
### PDT-Friendly Design
- **Trade Limiting**: Built-in daily trade counter for accounts under $25K
- **Selective Trading**: Priority scoring system for A+ setups only
- **Quality over Quantity**: Maximum 2-3 high-probability trades per day
## 🎯 Optimal Usage
### Best Timeframes
- **Primary**: 5-minute charts for entry timing
- **Secondary**: 1-minute for precise execution
- **Context**: Daily charts for gap analysis
### Ideal Market Conditions
- **Volatility**: High-volume, momentum-driven markets
- **Stocks**: Market cap $100M+, average volume 1M+ shares
- **Sectors**: Technology, biotech, growth stocks with news catalysts
### Account Requirements
- **Minimum**: $500+ for proper position sizing
- **Recommended**: $25K+ for unlimited day trading
- **Risk Tolerance**: Active day trading experience preferred
## 📊 Performance Optimization
### Entry Criteria (All Must Align)
1. ✅ Time filter (market hours, avoid lunch)
2. ✅ Volume spike (2x+ average volume)
3. ✅ Momentum confirmation (RSI 50-80)
4. ✅ Trend alignment (above EMA20)
5. ✅ Pattern completion (setup-specific)
### Risk Parameters
- **Maximum Risk**: 1-2% per trade
- **Position Size**: 25% of account maximum
- **Stop Loss**: 2 ATR below entry
- **Take Profit**: 2:1 risk-reward minimum
## 🔧 Customization Options
### Gap Trading Settings
- Minimum gap percentage threshold
- Volume multiplier requirements
- Gap validation criteria
### Pattern Recognition
- ABCD ratio parameters
- Swing point sensitivity
- Pattern completion filters
### Risk Management
- Risk-reward ratio adjustment
- Maximum daily trade limits
- Trailing stop trigger levels
### Time and Session Filters
- Trading session customization
- Lunch hour avoidance toggle
- Market condition filters
## ⚠️ Important Disclaimers
### Risk Warning
- **High Risk**: Day trading involves substantial risk of loss
- **Capital Requirements**: Only trade with risk capital
- **Experience**: Strategy requires active monitoring and experience
- **Market Conditions**: Performance varies with market volatility
### PDT Considerations
- **Day Trading Rules**: Accounts under $25K limited to 3 day trades per 5 days
- **Compliance**: Strategy includes trade counting for PDT compliance
- **Alternative**: Consider swing trading modifications for smaller accounts
### Backtesting vs Live Trading
- **Slippage**: Real trading involves execution delays and slippage
- **Commissions**: Factor in broker fees for accurate performance
- **Market Impact**: Large positions may affect fill prices
- **Psychological Factors**: Live trading involves emotional challenges
## 📚 Educational Value
This strategy serves as an excellent learning tool for understanding:
- Professional day trading methodologies
- Risk management principles
- Pattern recognition techniques
- Volume and momentum analysis
- Multi-timeframe analysis
## 🤝 Community and Support
Based on proven Warrior Trading methodologies with active community support. Strategy includes comprehensive plotting and information tables for educational purposes and trade analysis.
---
**Disclaimer**: This strategy is for educational purposes. Past performance does not guarantee future results. Always practice proper risk management and never risk more than you can afford to lose.
**Tags**: #DayTrading #Momentum #WarriorTrading #GapAndGo #ABCD #VWAP #PatternTrading #RiskManagement

AZ Dynamic Trend Indicator with Heikin-Ashi### Dynamic Trend Indicator with Heikin-Ashi (v2.7)
**Effortlessly identify trends and reversals** with this versatile tool combining multi-timeframe analysis, adaptive moving averages, and Heikin-Ashi smoothing. Here's what it offers:
#### 🔍 **Core Features**
1. **Dual Timeframe Analysis**:
- Track trends on higher timeframes (e.g., 1H/D) while viewing signals on your current chart.
- Toggle between **Heikin-Ashi** or standard candles for cleaner trend visualization.
2. **8 Customizable MAs**:
- Choose from **ALMA, HMA, SMA, SWMA, VWMA, WMA, ZLEMA, or EMA** with adjustable periods.
- Unique "Trend Strength" metric: `(MA_Close - MA_Open) / (MA_High - MA_Low)` highlights momentum direction.
3. **Smart Signals**:
- **Entry/Exit**: Triangles mark crossovers between MA Close/Open.
- **Reversal Alerts**: Detects counter-trend moves within a user-defined window (default: 3 bars) after signals.
- Color-coded plots: Bullish (🟢), Bearish (🔴), Reversal Bull (🔵), Reversal Bear (🟠).
#### 🎨 **Visual Customization**
- Toggle **High/Low MA lines**, **Close line**, and **fill colors**.
- Adjust colors for all elements to match your chart theme.
- Hide signals or reversal markers as needed.
#### ⚙️ **Practical Use**
- **Trend Following**: Use the MA Close/Open crossover with trend fill colors to confirm direction.
- **Reversal Trading**: Capitalize on pullbacks with reversal signals (e.g., after a bearish signal, watch for Bull Reversal markers).
- **Multi-Timeframe Confirmation**: Avoid false signals by aligning higher-timeframe trends with your entries.
*Ideal for swing traders and trend riders!*
**Note**: Adjust `MA Period`, `Reversal Window`, and `Trend Timeframe` for your strategy. Disable Heikin-Ashi in choppy markets for faster reactions.
---
*Code v2.7 updates: Optimized reversal logic, added ALMA/ZLEMA support, and enhanced visual controls.*

BTC Correlation CoefficientThe BTCUSDT Correlation Coefficient indicator measures the strength and direction of the relationship between the selected asset (e.g., a stock or altcoin) and the price of BTCUSDT over a chosen time period. It uses a custom correlation function to calculate how closely the asset's price movements align with Bitcoin, returning a value between -1 and +1. A coefficient near +1 indicates strong positive correlation, while values near -1 indicate inverse correlation. This helps traders assess whether the asset tends to follow Bitcoin’s price trends or behave independently, enabling more informed decisions on portfolio diversification and market sentiment alignment.

EMA Trend Dashboard
Trend Indicator using 3 custom EMA lines. Displays a table with 5 rows(position configurable)
-First line shows relative position of EMA lines to each other and outputs Bull, Weak Bull, Flat, Weak Bear, or Bear. EMA line1 should be less than EMA line2 and EMA line 2 should be less than EMA line3. Default is 9,21,50.
-Second through fourth line shows the slant of each EMA line. Up, Down, or Flat. Threshold for what is considered a slant is configurable. Also added a "steep" threshold configuration for steep slants.
-Fifth line shows exhaustion and is a simple, configurable calculation of the distance between EMA line1 and EMA line2.
--Lines one and five change depending on its value but ALL other colors are able to be changed.
--Default is somewhat set to work well with Micro E-mini Futures but this indicator can be changed to work on anything. I created it to help get a quick overview of short-term trend on futures. I used ChatGPT to help but I am still not sure if it actually took longer because of it.

Better MACD📘 Better MACD – Adaptive Momentum & Divergence Suite
Better MACD is a comprehensive momentum-trend tool that evolves the traditional MACD into a multi-dimensional, divergence-aware oscillator. It leverages exponential smoothing across logarithmic rate-of-change of OHLC data, adaptive signal processing, and intelligent divergence detection logic to provide traders with earlier, smoother, and more reliable momentum signals.
This indicator is built for professional-level analysis, suitable for scalping, swing trading, and trend-following systems.
🧬 Core Concept
Unlike the classic MACD which subtracts two EMAs of price, Better MACD constructs a signal by:
Applying logarithmic transformation on the change between OHLC components (Close, High, Low, Open).
Using double EMA smoothing to filter noise and volatility, Triangular method. 1st to 2nd Smoothing.
Averaging and de-biasing the results through a custom linear regression model, 4th Smoothing.
Subtracting a fast SMA and slow SMA response to yield a dynamic MACD value, 3rd Smoothing.
The result is a smooth, adaptive, and high-resolution MACD-style oscillator that responds more naturally to trend conditions and price geometry.
🧠 Features Breakdown
1. 📈 Multi-Layer MACD Engine
Src1: Smoothed Log Rate-of-Change on Close
Src2: Smoothed Log Rate-of-Change on High
Src3: Smoothed Log Rate-of-Change on Low
Src4: Smoothed Log Rate-of-Change on Open
These are blended using highest high, lowest low, and average Close price over a configurable window for more complete trend detection. The open-based Src4 is subtracted using SMA.
2. 🧮 Signal Line
A fast EMA (signalLength) of the Better MACD value is used for crossover logic.
Crossovers of MACD and Signal line signal potential entries or exits.
3. 📊 MACD Histogram
Visualizes the difference between MACD and Signal line.
Dynamically color-coded:
Green/Light Green for bullish impulse
Red/Pink for bearish impulse
Width and color intensity reflect strength and momentum slope.
🎨 Visual Enhancements
Feature Description
✅ Ribbon Fill Optional fill between MACD and Signal line, colored by trend direction
✅ Zero-Line Background Background highlights above/below 0 to easily read bullish/bearish bias
✅ Crossover Highlights Tiny circles plotted when MACD crosses Signal line
🔍 Divergence Detection Suite
The script includes a full Divergence Engine to detect:
🔼 Bullish Regular Divergence (Price lower lows + Indicator higher lows)
🔽 Bearish Regular Divergence (Price higher highs + Indicator lower highs)
🟢 Bullish Hidden Divergence (Price higher lows + Indicator lower lows)
🔴 Bearish Hidden Divergence (Price lower highs + Indicator higher highs)
🧩 Divergence Modes:
Supports both Regular, Hidden, or Both simultaneously
Detects from either Close Price or Heikin Ashi-derived candles
Uses dynamic pivot tracking with configurable lookback and divergence sensitivity
Divergence lines are labeled, colored, and plotted in real-time
🔁 Styling & Customization:
Choose from Solid, Dashed, or Dotted line styles
Configure separate colors and widths for all divergence types
Control number of divergence lines visible or only show the most recent
Divergences update live without repainting
⚠️ Alerts
Alerts are built-in for real-time notification:
MACD Histogram reversals (rising → falling, or vice versa)
Divergence signals (all 4 types, grouped and individually)
Combines seamlessly with TradingView alerts for actionable triggers
🔧 Input Controls (Grouped by Purpose)
Better MACD Group
1st–4th Smoothing Lengths: Controls responsiveness of MACD core engine
Signal Length: Smoothness of signal line
Toggles for crossover highlights, zero cross fills, and ribbon fills
Divergence Settings
Enable/disable divergence lines
Choose divergence type (Regular, Hidden, Both)
Set confirmation requirements
Customize pivot detection and bar search depth
Styling Options
Colors, line widths, and line styles for each divergence type
Heikin Ashi Mode for smoother pivots and divergences
🧠 How to Use
✅ For Trend Traders:
Use MACD > Signal + Histogram > 0 → Bullish confirmation
MACD < Signal + Histogram < 0 → Bearish confirmation
Wait for pullbacks with hidden divergences to enter in trend direction
✅ For Reversal Traders:
Look for Regular Divergences at trend exhaustion points
Combine with price action (e.g., support/resistance or candle pattern)
✅ For Swing & Day Traders:
Enable Heikin Ashi Mode for smoother divergence pivots
Use zero line background + histogram color to time entries
📌 Summary
Feature Description
🚀 Advanced MACD Core Smoother, more reliable, multi-source-based MACD
🔍 Divergence Engine Detects 4 divergence types with pivot logic
🎯 Real-Time Alerts Alerts for histogram slope and divergences
🎛️ Deep Customization Full styling, smoothing, and detection controls
📉 Heikin Ashi Support Improved signal quality in trend-based markets

ANDROMEDA - TrendSyncANDROMEDA - TrendSync
Pedro Canto - Portfolio Manager | CGA/CGE
OVERVIEW
Trend Sync is a multi-layered trend-following indicator designed to help traders identify high-probability trend continuation setups while avoiding low-quality entries caused by overbought or oversold market conditions.
This indicator combines the power of Moving Averages (MA), MACD , and a visual RSI-based filter to validate both trend direction and timing for entries. It's goal is simple: filter out noise and highlight only the most technically relevant buy and sell signals based on objective momentum and trend criteria.
---
WALKTHROUGH
This indicator is built for traders seeking to operate in the direction of established trends. It's core principle is to identify and validate current trend conditions, and then signal entry opportunities during pullbacks to key moving averages.
Trend identification is achieved through the alignment of two moving averages. When these MAs are crossed and angled in the same direction, they confirm that a trend is in progress. To double-confirm trend direction, the MACD histogram is used—only. When both the MAs and MACD are aligned in the same direction, then the trend is considered valid.
Once all trend criteria are met, a dynamic coloring system is activated to visually reinforce the trend across the candles and moving averages.
To avoid poor entries during market exhaustion, an RSI-based filter is used. This short-term RSI highlights overbought or oversold zones, helping traders filter trades in extreme price conditions.
Only when the trend is validated and price pulls back to one of the MAs will a buy/sell signal be triggered, aligning momentum, price action and timing into a single actionable setup.
This combination ensures that each component plays a specific role:
i) Moving Averages define the trend
ii) MACD validates it
iii) RSI filters noise
iv) Intrabar price action triggers entries
This synchronism helps improve decision-making and entry timing, especially for swing and intraday traders.
---
USE CASES
- Identifying trend continuation setups
- Filtering false signals during consolidation phases
- Avoiding trades in overbought or oversold zones
- Enhancing entry timing for both swing and intraday strategies
- Providing visual confirmation of trend strength and momentum alignment
---
KEY FEATURES
1. Dual Moving Average Setup
The indicator allows full customization of two moving averages (MA1 and MA2), supporting both EMA and SMA types. The slope of the longer MA (MA2) acts as an essential trend filter, ensuring signals are only generated when the market shows clear directional bias.
2. MACD Histogram Trend Confirmation
A classic MACD Histogram calculation is used to validate the momentum of the prevailing trend.
- Bullish Trend: Histogram > 0
- Bearish Trend: Histogram < 0
This step filters out counter-trend signals and ensures trades are aligned with momentum.
3. Intrabar Price Trigger
Unlike standard crossover systems, this indicator waits for intrabar price action to trigger entries:
- Buy Signal: Price crosses below one of the MAs during an uptrend (dip-buy logic)
- Sell Signal: Price crosses above one of the MAs during a downtrend (rally-sell logic)
This intrabar trigger improves entry timing and helps capture retracement-based opportunities.
4. RSI Visual Filter
A short-term RSI is plotted and color-coded to visually highlight overbought and oversold conditions, acting as a discretionary filter for users to avoid low-probability trades during exhaustion points.
5. Dynamic Coloring System
Bar Colors:
- Blue: Bullish trend
- Red: Bearish trend
- Orange: RSI Overbought/Oversold zones
MA Colors:
- Blue for bullish conditions
- Red for bearish conditions
- Gray for neutral/no-trend phases
6. Signal Markers and Alerts
Clear visual buy and sell markers are plotted directly on the chart.
Additionally, the indicator includes real-time alerts for both Buy and Sell signals, helping traders stay informed even when away from the screen.
---
INPUTS AND CUSTOMIZATION OPTIONS
- Moving Average Types: EMA or SMA for both MA1 and MA2.
- MACD Settings: Customizable fast, slow, and signal periods.
- RSI Settings: Source, length, and overbought/oversold levels fully adjustable.
- Color Customization: Adjust RSI zone colors to suit your chart theme.
---
DISCLAIMER
This indicator is a technical analysis tool designed for educational and informational purposes only. It should not be used as a standalone trading system. Always combine it with sound risk management, price action analysis, and, where applicable, fundamental context.
Past performance does not guarantee future results.

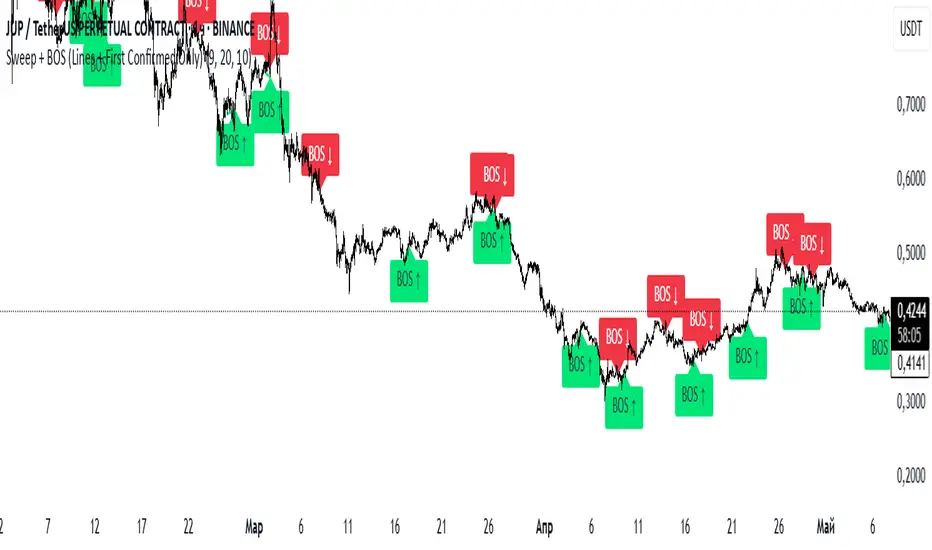
Sweep + BOS (Lines + First Confirmed Only)🔍 Indicator: Sweep + BOS (Break of Structure with Visual Lines)
🧠 Overview
This indicator combines Swing detection, Liquidity Sweeps, and Break of Structure (BOS) logic, with:
Customizable swing length,
BOS signals only after confirmed sweeps,
BOS shown only once per sweep,
Visual labels and connecting lines to highlight structure breaks clearly.
⚙️ Inputs
Swing Length:
Defines how many candles to use to identify a swing high/low. Must be an odd number (e.g., 3, 5, 7...).
Sweep Lookback Window:
Sets how far back the script checks for a sweep (false breakout over a swing).
BOS Validity After Sweep:
Number of bars within which a BOS can be considered valid after a sweep.
Toggle Options:
Show/hide:
Swing Labels
Sweep Labels
BOS Labels
BOS Connecting Lines
📌 Logic Breakdown
✅ Swings
Swing High: A candle’s high is greater than the highs of all N candles on both sides.
Swing Low: A candle’s low is lower than the lows of all N candles on both sides.
💧 Liquidity Sweeps
Sweep High:
Price spikes above a previous Swing High,
Then closes back below it (false breakout).
Sweep Low:
Price drops below a previous Swing Low,
Then closes back above it.
🔁 Break of Structure (BOS)
A BOS is only shown if:
It occurs after a valid sweep (within X bars),
It hasn’t been already plotted for that sweep,
BOS ↑ is only possible after Sweep Low,
BOS ↓ is only possible after Sweep High,
Opposite BOS type resets the last BOS state.
BOS ↑ (Bullish):
Confirmed when price closes above previous Swing High after Sweep Low.
Label appears at the candle low.
A line is drawn from the Swing Low to the BOS candle.
BOS ↓ (Bearish):
Confirmed when price closes below previous Swing Low after Sweep High.
Label appears at the candle high.
A line is drawn from the Swing High to the BOS candle.
IU Fibonacci Levels For IntradayDESCRIPTION
This indicator draws intraday Fibonacci levels from the opening price of the day using percentage-based retracements. It helps traders identify potential intraday support and resistance zones derived from the day’s opening bias. The levels are dynamically calculated and displayed with optional labels and customizable colors, making it an effective tool for both breakout and mean-reversion intraday strategies.
USER INPUTS
Direction Of The Level
Choose whether to show Upside, Downside, or Both level sets based on your directional bias.
Show Labels of Levels
Option to enable or disable text labels displaying Fibonacci values and prices.
Individual Level Toggles & Colors
You can choose to show or hide each of the following Fibonacci levels and set their respective colors:
* 0.236
* 0.328
* 0.500
* 0.618
* 0.786
* 1.000
INDICATOR LOGIC
On the first bar of the session, the opening price is captured.
Fibonacci levels are then calculated above and below this open using percentage multipliers (for example, day\_open + (day\_open \* 0.236%) for the 0.236 level).
Depending on the selected direction, upside and/or downside levels are plotted.
Filled zones are drawn between levels to visually highlight key price zones.
Optionally, each level can be labeled with its Fibonacci value and price.
WHY IT IS UNIQUE
Unlike traditional swing-based Fibonacci retracements, this tool uses the day’s opening price as an anchor, specifically designed for intraday traders.
Allows traders to quickly visualize micro-support and resistance levels that adapt every day.
Highly customizable and easy to read, with filled level bands for better zone recognition.
Works independently of indicators like RSI, MACD, or moving averages – purely based on price action logic.
HOW USER CAN BENEFIT FROM IT
Spot precise intraday reversal zones or breakout regions.
Combine with price action or volume analysis for smarter entries.
Filter trades by choosing directional bias (Up Site, Down Site, or Both).
Set profit targets or stop-losses based on Fibonacci bands.
Works great for scalpers, day traders, and even short-term swing traders looking to align with opening price momentum.
Disclaimer
This indicator is not financial advice, it's for educational purposes only highlighting the power of coding( pine script) in TradingView, I am not a SEBI-registered advisor. Trading and investing involve risk, and you should consult with a qualified financial advisor before making any trading decisions. I do not guarantee profits or take responsibility for any losses you may incur.

Normalized EMA Cycle (NEC)Normalized EMA Cycle (NEC)
The Normalized EMA Cycle (NEC) is a versatile momentum and trend reversal tool designed to detect high-probability turning points and gauge the strength of price cycles.
It combines fast and slow Exponential Moving Averages (EMAs), dynamic normalization, and adaptive transparency to create clear, intuitive reversal signals on the chart.
🔹 How It Works
EMA Differencing
The NEC calculates the difference between a fast EMA and a slower EMA:
Fast EMA Length (default 6) captures short-term momentum.
Slow EMA Length (default 16) tracks broader trends.
The slope of this difference identifies accelerating or decelerating momentum.
Normalization to 0–100 Scale
The raw EMA difference is scaled relative to the recent Alpha Period range (default 6 bars).
This transforms the value into a normalized oscillator ranging between 0 and 100.
A 3-period Hull Moving Average (HMA) smooths this series to reduce noise.
Overbought and Oversold Thresholds
By default:
Overbought Level: 75
Oversold Level: 25
Crossovers of these levels are used to detect potential reversals.
Adaptive Alpha Adjustment
The normalized value is transformed into an “Alpha Schaff” line, dynamically shifting between price and normalized cycles.
This helps the model adjust to different volatility regimes.
Trend Reversal Logic
Bullish Reversal:
Normalized oscillator crosses above the Oversold Level.
EMA difference slope is positive.
Bearish Reversal:
Normalized oscillator crosses below the Overbought Level.
EMA difference slope is negative.
Additional confirmation comes when price crosses the Alpha Schaff line in the direction of momentum.
Dynamic Confidence Visualization
The indicator calculates a trend confidence score based on the normalized separation of the EMAs.
The transparency of reversal markers dynamically adjusts:
Strong trends = more opaque signals
Weak trends = more transparent signals
🔹 How to Use
✅ Entries
Long Signal: Aqua upward label appears below a bar.
Conditions:
Bullish reversal or price crossing above Alpha Schaff
Normalized slope is rising
Short Signal: Fuchsia downward label appears above a bar.
Conditions:
Bearish reversal or price crossing below Alpha Schaff
Normalized slope is falling
✅ Trend Strength
The less transparent the signal marker, the more significant the trend.
✅ Customization
Use the inputs to fine-tune sensitivity:
Shorter EMAs: Faster signals
Longer EMAs: Smoother trends
Alpha Period: Adjusts the lookback range for normalization
🟢 Best Practices
NEC is best used in combination with other trend confirmation tools (e.g., price structure, volume, or higher timeframe EMAs).
Avoid relying on signals in extremely low-volume or choppy ranges.
⚠️ Disclaimer
This script is intended for educational purposes only and does not constitute financial advice. Trading involves substantial risk, and you should consult your financial advisor before making any investment decisions.

Gabriel's Andean Oscillator📈 Gabriel's Andean Oscillator — Enhanced Trend-Momentum Hybrid
Gabriel's Andean Oscillator is a sophisticated trend-momentum indicator inspired by Alex Grover’s original Andean Oscillator concept. This enhanced version integrates multiple envelope types, smoothing options, and the ability to track volatility from both open/close and high/low dynamics—making it more responsive, adaptable, and visually intuitive.
🔍 What It Does
This oscillator measures bullish and bearish "energy" by calculating variance envelopes around price. Instead of traditional momentum formulas, it builds two exponential variance envelopes—one capturing the downside (bullish potential) and the other capturing the upside (bearish pressure). The result is a smoothed oscillator that reflects internal market tension and potential breakouts.
⚙️ Key Features
📐 Envelope Types:
Choose between:
"Regular" – Uses single EMA-based smoothing on open/close variance. Ideal for shorter timeframes.
"Double Smoothed" – Adds an extra layer of smoothing for noise reduction. Ideal for longer timeframes.
📊 Bullish & Bearish Components:
Bull = Measures potential upside using price lows (or open/close).
Bear = Measures downside pressure using highs (or open/close).
These can optionally be derived from high/low or open/close for flexible interpretation.
📏 Signal Line:
A customizable EMA of the dominant component to confirm momentum direction.
📉 Break Zone Area Plot:
An optional filled area showing when bull > bear or vice versa, useful for detecting expansion/contraction phases.
🟢 High/Low Overlay Option (Use Highs and Lows?):
Visualize secondary components derived from high/low prices to compare against the open/close dynamics and highlight volatility asymmetry.
🧠 How to Use It
Trend Confirmation:
When bull > bear and rising above signal → bullish bias.
When bear > bull and rising above signal → bearish bias.
Breakout Potential:
Watch the Break area plot (√(bull - bear)) for rapid expansion, signaling volatility bursts or directional moves.
High/Low Envelope Divergence:
Enabling the high/low comparison reveals hidden strength or weakness not visible in open/close alone.
🛠 Customizable Inputs
Envelope Type: Regular vs. Double Smoothed
EMA Envelope Lengths: For both regular and smoothed logic
Signal Length: Controls EMA smoothing for the signal
Use Highs and Lows?: Toggles second set of envelopes; the original doesn't include highs and lows.
Plot Breaks: Enables the filled “break” zone area, the squared difference between Open and Close.
🧪 Based On:
Andean Oscillator - Alpaca Markets
Licensed under CC BY-NC-SA 4.0
Developed by Gabriel, based on the work of Alex Grover

Swing High/Low with Liquidity Sweeps🧠 Overview
This indicator identifies swing highs and swing lows based on user-defined candle lengths and checks for liquidity sweeps—situations where the price breaks a previous swing level but then closes back inside, indicating a potential false breakout or stop hunt. It also supports visual labeling and alerts for these events.
⚙️ Inputs
Swing Length (must be odd number ≥ 3):
Determines how many candles are used to identify swing highs/lows. The central candle must be higher or lower than all neighbors within the range.
Example: If swingLength = 5, the central candle must be higher/lower than the 2 candles on both sides.
Sweep Lookback (bars):
Defines how many bars to look back for possible liquidity sweeps.
Show Swing Labels (checkbox):
Optionally display labels on the chart when a swing high or low is detected.
Show Sweep Labels (checkbox):
Optionally display labels on the chart when a liquidity sweep occurs.
🕯️ Swing Detection Logic
A Swing High is detected when the high of the central candle is greater than the highs of all candles around it (as per the defined length).
A Swing Low is detected when the low of the central candle is lower than the lows of surrounding candles.
Swing labels are placed slightly above (for highs) or below (for lows) the candle.
💧 Liquidity Sweep Logic
A Sweep High is triggered if:
The current high breaks above a previously detected swing high,
And then the candle closes below that swing high,
Within the configured lookback window.
A Sweep Low is triggered if:
The current low breaks below a previous swing low,
And then closes above it,
Within the lookback window.
These are often seen as stop hunts or fake breakouts.
🔔 Alerts
Sweep High Alert: Triggered when a sweep above a swing high occurs.
Sweep Low Alert: Triggered when a sweep below a swing low occurs.
You can use these to set up TradingView alerts to notify you of potential liquidity grabs.
📊 Use Cases
Identifying market structure shifts.
Spotting fake breakouts and potential reversals.
Assisting in smart money concepts and liquidity-based trading.
Supporting entry timing in trend continuation or reversal strategies.
